- Details
- Last Updated on Tuesday, 19 July 2016 18:18

Sand Texture Sedimentology
MY PRINCIPLES
The 1983 Journal of Sedimentary Petrology editorial by Robert Ehrlich indicated the after WWII efforts in measuring and interpretation of granularity (moments etc.) as tatting - vasted time. It was correct. It stopped the work and publications in that area almost completely, except for my research, because I knew two main reasons of the failure:
- sieving or inexpensive settling tubes using too great samples;
- using higher statistical moments (skewness and kurtosis) for distribution interpretation.
Dispersity characteristics (see Distribution Variables and Dispersity Unit) find application in many fields. One application, important in the Earth Sciences, is Sand Texture Sedimentology. It places the highest demands on:
-
the choice of the dispersity unit — the settling rate instead of the commonly-used grain size;
-
the measurement accuracy.
After I found the following facts proven:
- the sedimentation velocity of a single grain is the most accurate measure of grain size
- the sedimentation velocity of sand grains is more related to their deposition (origin) than their size is
- whereas the two grain size attributes (particle density and shape) must be known to define it, the sedimentation velocity is free of the grain size attributes; only its environmental attributes should be known: gravity acceleration, fluid density and viscosity; however, they are constants evenly influencing one sedimentation basin.
I proceeded to:
- study the conditions for unhindered sedimentation of multiple sand grains;
- mathematically define the relationship among grain size — grain shape — grain density — sedimentation velocity; I used the drag coefficient as a function of Reynolds' number and shape factor of sedimenting particles.
My developmental work followed three paths:
1. Sedimentation Experiments (J. Brezina, 1971b, 1972a)
Stratified Sedimentation of Sand-Sized Particles in Water
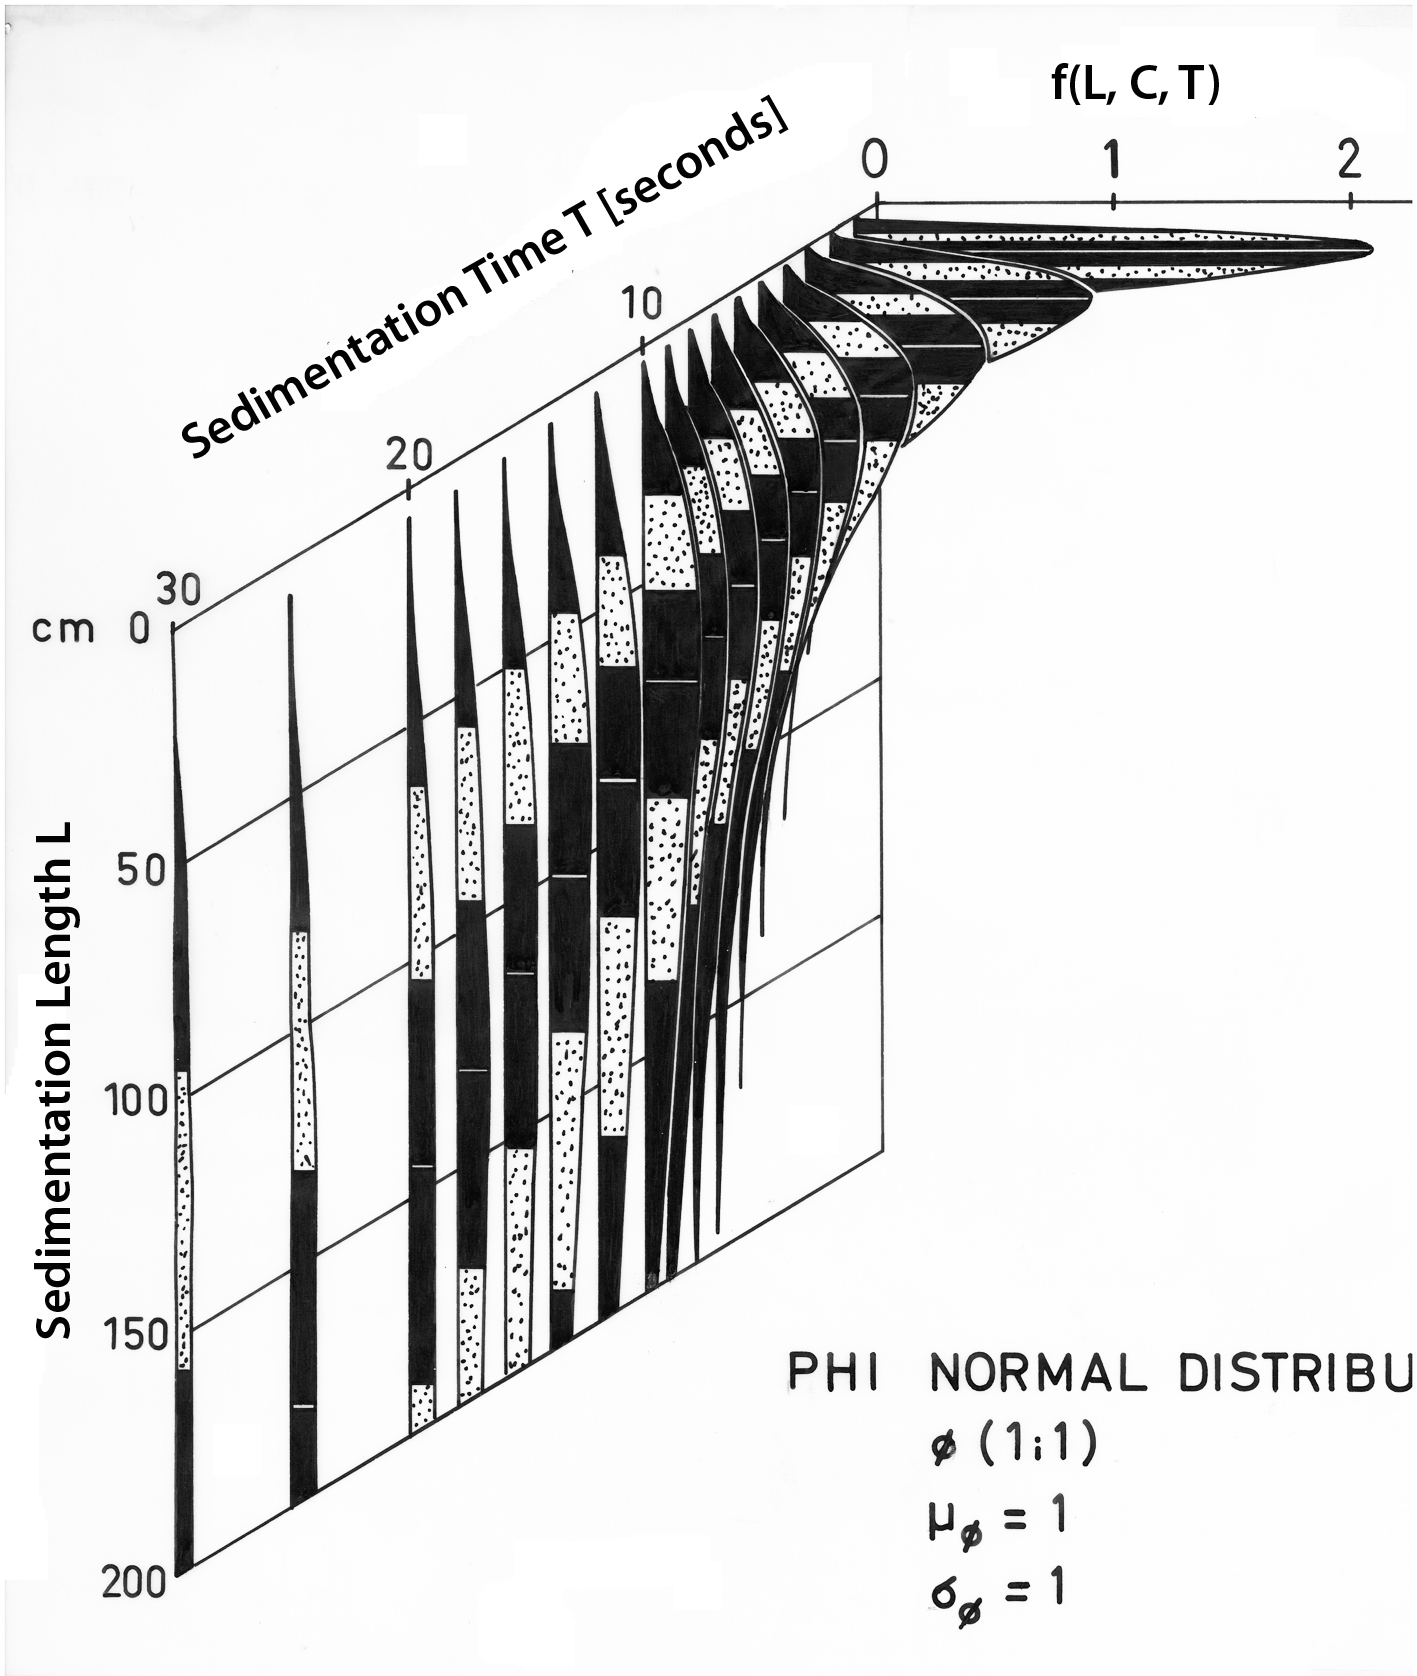
 Gravity accelerates the sand-sized particles in water enough that they separate from each other rapidly. This makes possible to use a stratified sedimentation, i. e. from top into clear water, and avoid using the Odén's sedimentation of homogeneous suspension needed for fine particles that do not separate from each other by sedimentation;
- Though a stratified sedimentation of sand-sized particles decreases the particle concentration rapidly, the on top maximum concentration must be reduced by the On Top suspension homogenization;
- I focused my experiments onto two types of the particle concentration effects: (a) suspension density streaming, (b) mutual influence of sedimenting particles. Study of the both these effects showed, that the sand particle centers must be at least 3.4 mm apart from each other, independent of particle size.
- This defines the maximum sample size to be about 18000 particles for 20 cm sedimentation column diameter, quartz particle density, medium particle shape (SF = 0.6 to 0.7), distilled water at about 20°C and standard gravity acceleration. In grams it is: W = 25 dc3, where dc is the critical particle diameter in millimeters;
- Then the particle settling velocities are not influenced by collective sedimentation (J. Brezina, 1971b, 1972a). These samples sediment as their individual particles would do;
- That small sample size sets the highest requirements for the Analyzer's Underwater Balance:sensitivity, S/N (signal to noise) ratio, and the weighing response speed;
- Extreme care must be taken for sample cleaneness - only analyzable material must be used - i. e. free of particles outside of the analysis range, such as fines, free of solubles, such as salts, organics and other "dirt";
- Extreme care must be taken not to exceed the above defined maximum sample size; for this purpose, a carefull and patient sample splitting by a good rotational sample splitter must be applied.
On-Top Suspension Homogenization
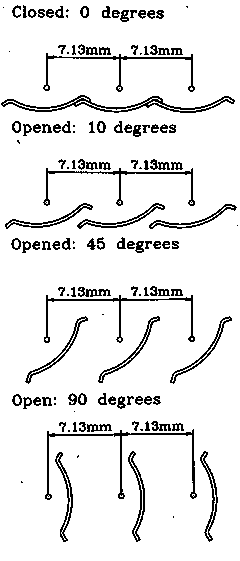
- Sample Introduction with Homogenization — samples are quantitatively released on top of the sedimentation column (items 2 and 3) and their maximum concentration is reduced by lamellae homogenization in the uppermost 5 cm of the column;
- Eccentric Rotation of the Venetian Blind Lamellae — the eccentric rotation of the concave lamellae flushes all particles from them (schematic drawing on the right).
Sedimentation Column Dimensions
- Sedimentation Length — because the sand-sized particles sediment in water rapidly and the maximum sedimentation time for the finest particles should be 15 minutes, the sedimentation length is limited by the maximum of 2 meters. Because the sedimentation length improves the ratio of the undisturbed to disturbed column portions, the optimum sedimentation length is 180 cm;
- Sedimentation Column Diameter — a balance pan radius must exceed the sedimentation column radius by 2.5 cm in order to collect all particles which diverge shortly above the pan; the rapid sand sediment cumulation requires a sufficiently fast and measurable pan weighing depression (see the Underwater Balance Development). This is why the sedimentation column diameter must be 20 cm.
Sensitivity & Speed of Weighing
- Extreme Weight Resolution — the balance output signal is resolved to 0.01 % and adjusted to any sample size (0.05 gram to 5 gram);
- Extremely Fast Underwater Weighing — the minimum weighing depression of the balance pan makes it extremely fast and robust.
- Signal Noise Reduction — both by strong insulaion of the sedimentation column from environmental vibration snd mathematical filtering of the balance output signal.
2. Universal Sedimentation Equation (J. Brezina 1979b)
- I selected the most precise data on drag coefficient, Reynolds’ number & Shape Factor of sedimenting sand-sized grains, especially those by SCHULZ, WILDE & ALBERTSON (1954) and COLBY & CHRISTENSEN (1957). Following their recommendation, I decided to use the Corey’s Shape Factor as the hydrodynamically most efficient particle shape descriptor.
- I used a mathematical relationship for the drag coefficient as a function of the Reynolds’ number and Corey’s Shape Factor and determined the optimum parameters of the selected polynomial equation by controlled regression. Particularly, I adjusted the parameters so, that the equation’s exponent converged to that of the Stokes’ law for logRe<0.1 and to that of the Newton’s law for logRe>3. The resulting function enables the explicit calculation of any involved variable, such as grain size, grain settling velocity, grain density, hydrodynamic grain shape, etc..
Our SedVarNC™ and SedVarDC™ programs compute the variables numerically using the Newton-Raphson convergence. John M. Brudowsky (2006) has developed algebraic solutions of my equations.
3. Constructional & Algorithmic Solutions
I developed two unique instruments & software:
- Sand Sedimentation Analyzer, SSA, or MacroGranometer™ - The system consists of:
- Settling tube of robust glass modules. It features 180 cm sedimentation length and 20 cm inner diameter. It is suspended on air shock absorbers in order to insulate the sensitive Underwater Balance from environmental vibration.
- Venetian Blind for sample introduction and on-top suspension homogenization.
- Underwater Balance (J. Brezina, 1972b) for sensitive and rapid sediment load sensing. The design is so robust, that it enables a sample removal by balance tilt without locking.
- Control & measuring electronics for instrument operation and analysis record.
- Control & measuring software performing temperature sensing on top and bottom of the sedimentation column, Venetian Blind vibrational opening for 3 seconds, sample removal from the balance pan by its slow tilting, and sediment weighing at equidistant intervals of 0.02 PSI settling velocity
- Sand Sedimentation Separator™, 3S™- The system consists of:
- Settling tube of robust glass modules. It features 180 cm sedimentation length and 20 cm inner diameter;
- Venetian Blind for sample introduction and suspension homogenization;
- Separation Unit placed at the bottom of the sedimentation column; it consists of two convergent tilted conveyor belts moving sediment into one of two alternating chambers, from which the sediment fractions are flushed out of the sedimentation column into one of the 25 sample collectors;
- Water circulation & flushing unit with a pump, electrically controlled valves, hoses, and flowmeter. Hooked onto the unit is a water container with a rotational cover on top carrying 25 sample collectors with porous bottom (they can be extended during the separation by up to about 5 additional sample collectors);
- Control electronic circuitry with an interface to the user's PC;
- MS WINDOWS operational software running on the user's PC.
- SedVarDC™ — Distribution Conversion software, which converts the laboratory settling velocity of a distribution into any other independent sedimentation variables (dispersity unit), such as shape specified grain size, grain density, grain shape, grain Reynolds' number, standard and local settling velocities; under any terms, such as gravity acceleration, sedimentation liquid (distilled water and salinity specified salt water), temperature, liquid density and kinematic viscosity.
- SedVarNC™ — Number Conversion software, which mutually converts any sedimentation variable, such as settling velocity, shape specified grain size, grain density, grain shape and grain Reynolds' number to any terms, such as gravity acceleration, sedimentation liquid (distilled water and salinity specified salt water), temperature, liquid density and kinematic viscosity.
- Shape™ — distribution processing software, which decomposes the measured PSI and PHI-sieve distributions into up to 5 Gaussian (normal) components - using the method by Isobel CLARK (1977). If the distributions are from the same material, Shape™ can match the PSI to PHI values by the equality of their inverse functions; from the matched PSI-PHI couples, it calculates SF values, which can be used as a variable SF file in the SedVarDC™: using the PHI-values with the variable SF-values, SedVarDC™ calculates the PHI distributions as they would be measured by sieves, however, with a high (0.02 PHI) resolution and improved accuracy (nevertheless, with the intrinsic sieving deficiencies of particle size definition).

