
- Details
- Last Updated on Friday, 15 April 2016 01:25

Products & Services | Products | Analyzer
Advanced Sand Sedimentation Analyzer: MacroGranometer™
MacroGranometer™ is a high technology sedimentation analyzer of water-insoluble, sand-sized material, using gravity sedimentation from a single level (stratified sedimentation) in water. The extremely low sediment concentration makes it the unique tool for sand sedimentology, which provides unique high quality and meaningful results, with added operational and maintenance ease, and a variety of outputs.
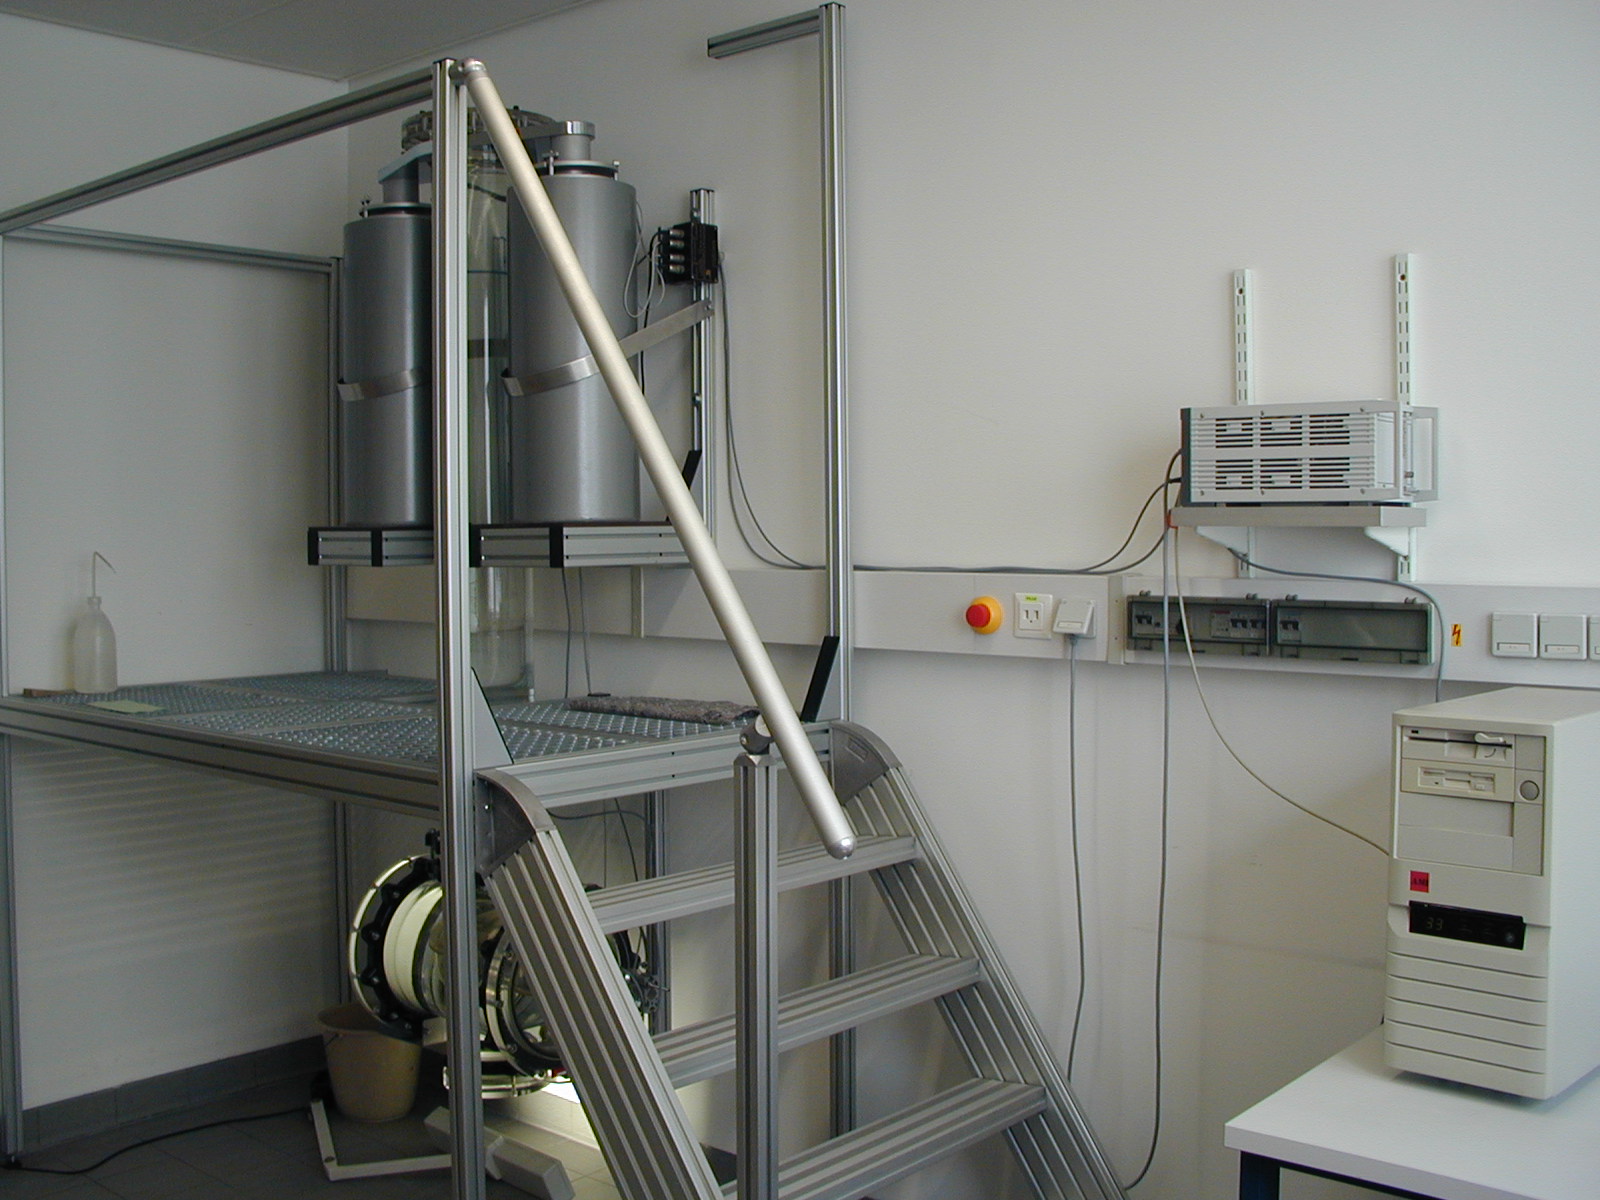
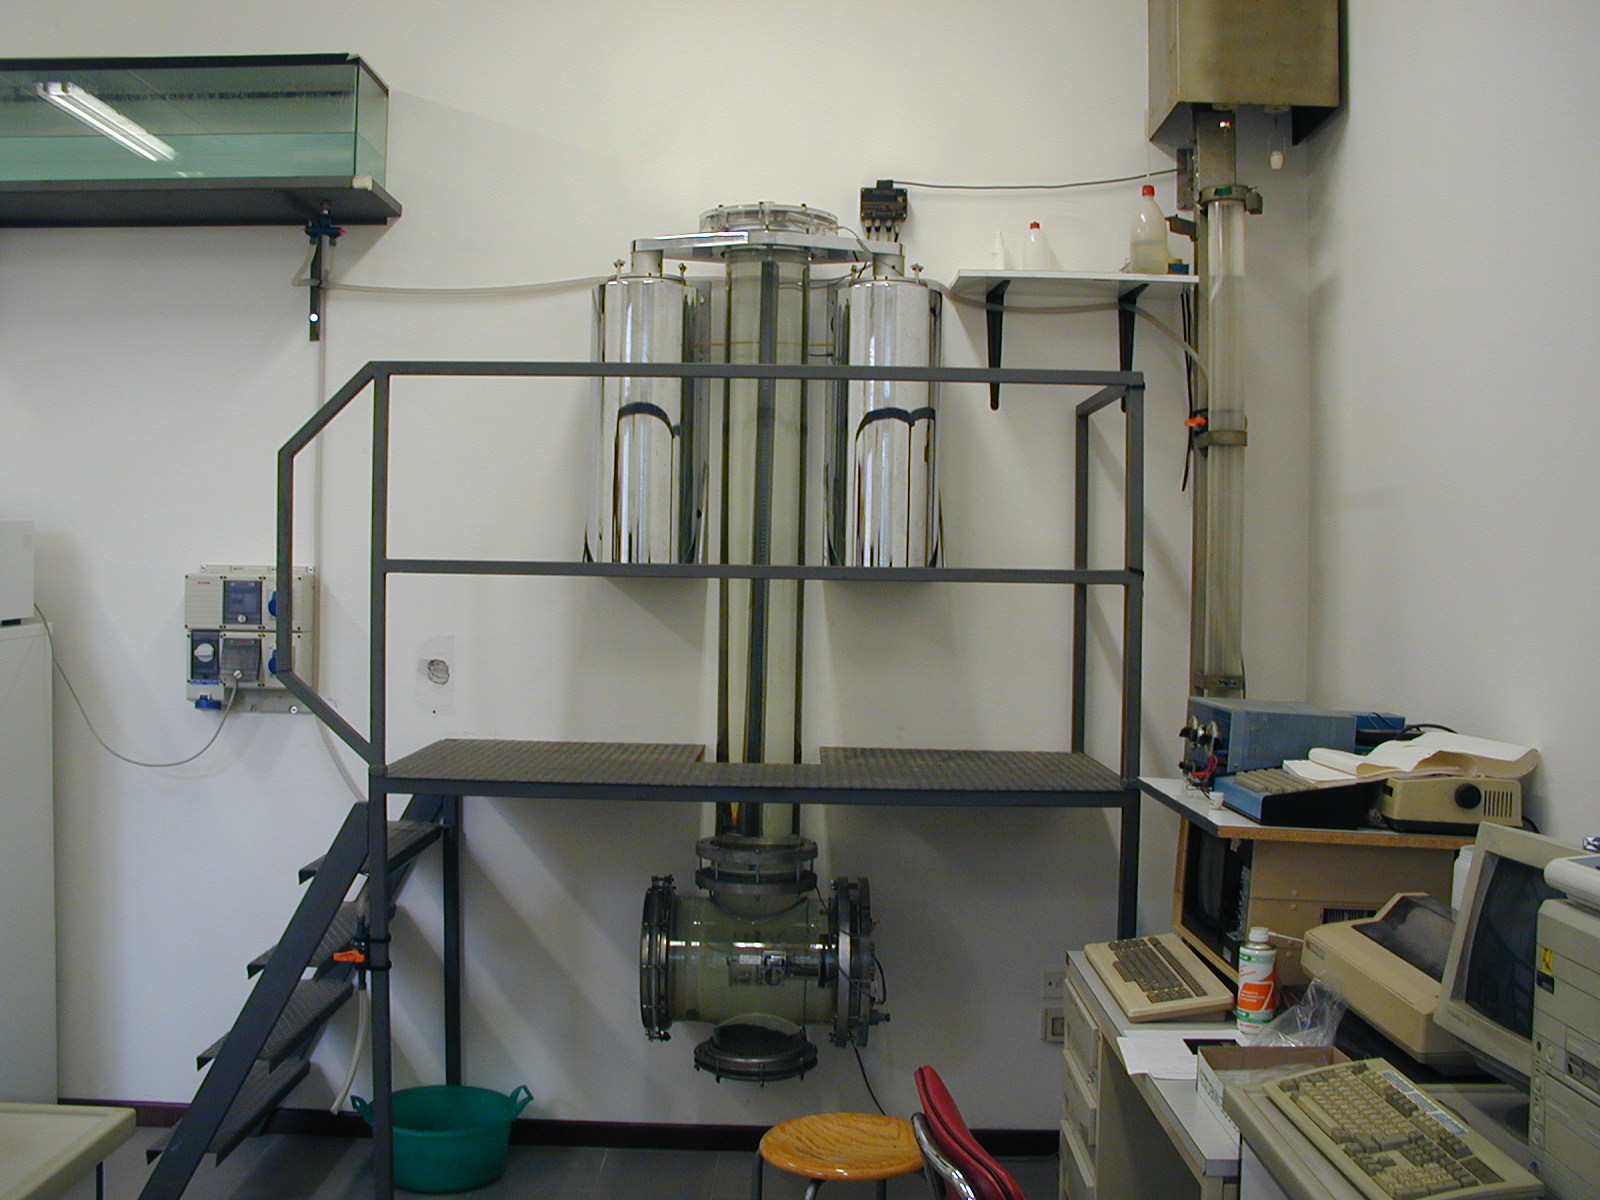
The MacroGranometer™installed at the Geological Institute, University of Vienna, Austria, viewed by the famous art photographer Lois Hammerhuber, is shown below (see also here - click; its installation at the Geological Institute, University of Trieste, Italy, see here - click):
By Courtesy of Lois Lammerhuber/Edition Lammerhuber, Austria
MacroGranometer™ measures the sedimentation velocity distribution, and its data processing program, SedVar™, converts it into distributions of other sedimentation variables, such as the shape-specified grain size. For the conversion, the equation for drag coefficient as a function of Reynolds' number and grain shape developed by J. Brezina (1979b) is utilized.
The following sedimentation variables can be used as independent distribution variables (sedimentation can occur if the densities of the fluid is smaller than that of the solid): :
|
|
Gravity acceleration |
|
temperature |
|
|
PSI — sedimentation velocity, three versions: |
|
|
|
|
|
• laboratory |
measured lab terms |
any |
any |
any |
|
• standard |
calculated standard terms |
980.665 |
distilled water |
24° |
|
• local |
calculated terms |
any*) |
any**) |
any |
|
*) Our SedVar™ can calculate gravity from latitude and altitude; **) Our SedVar™ accepts also salt water |
||||
|
grain shape — constant and PSI/PHI-dependent |
||||
Distributions of monosized samples (consisting of nearly equal grain size such as narrow sieve fractions) can be converted into distributions of particle density, because the particle shape (especially for particles finer than 0.5 mm) has negligible influence on settling velocity. The density distribution reveals data for mineral identification from the density values. Our SHAPE™ program can determine the distribution density components with mean(s), standard deviation(s) and percentage(s) of each component.
Our processing software SedVar™ also computes distributions of the grain sedimentational Reynolds' number; these distributions, similarly to those of PSI sedimentation velocity, feature a less negative skewness than the pertinent PHI grain size distributions. In fact, the skewness of the grain sedimentational Reynolds' number distributions has a medium value between the most negatively skewed PHI, and least negatively skewed PSI distributions). Not only that our Reynolds' number distributions use the shape-specified grain size but it can be computed for monosized samples. .
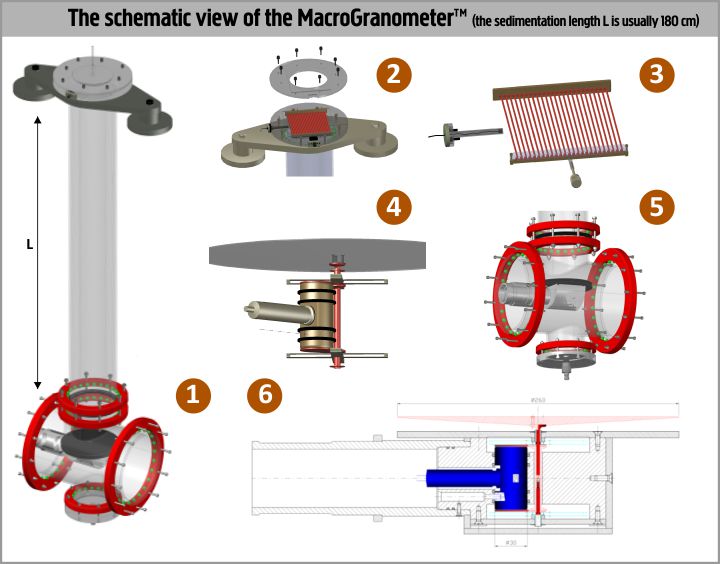
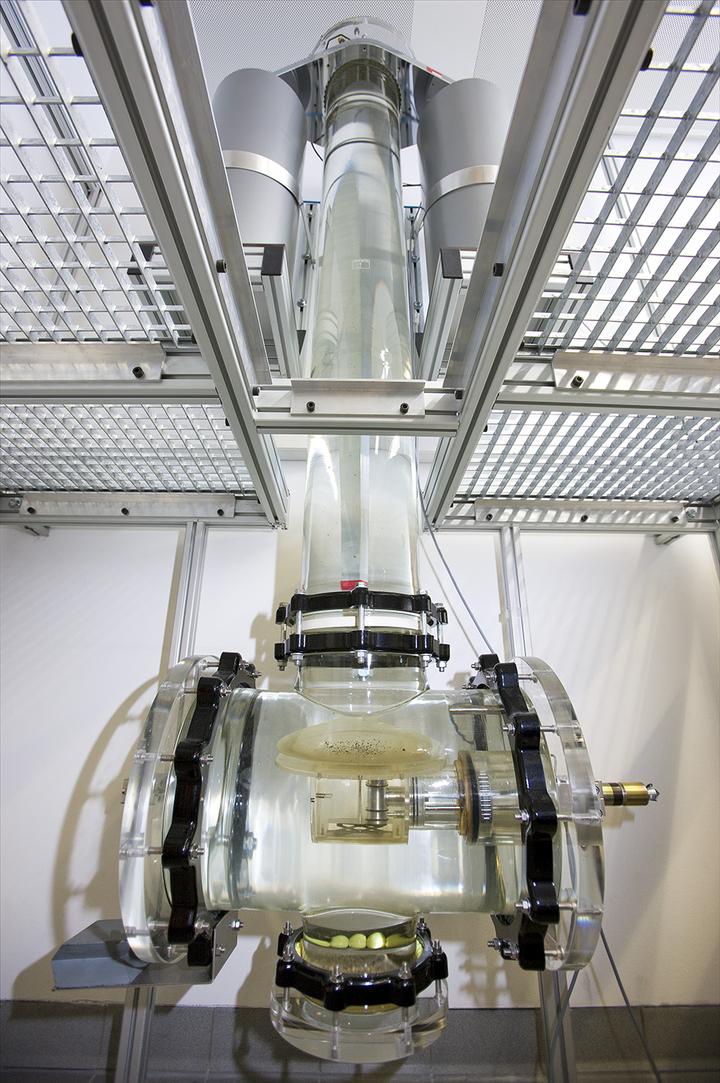
(1) 3-D view of the MacroGranometer's™ Sedimentation Tube (larger view: klick) (2) 3-D view of the Upper Part of the Sedimentation Tube: Venetian Blind (sample introduction) (3) Open lamellae of the Venetian Blind with electronic thermometer (without rotational electromagnet etc.)(4) 3D-View of the Underwater Balance Body(5) 3-D view of the Lower Part of the Sedimentation Tube with the Underwater Balance (larger view: klick)(6) Underwater Balance Body (larger view: klick)
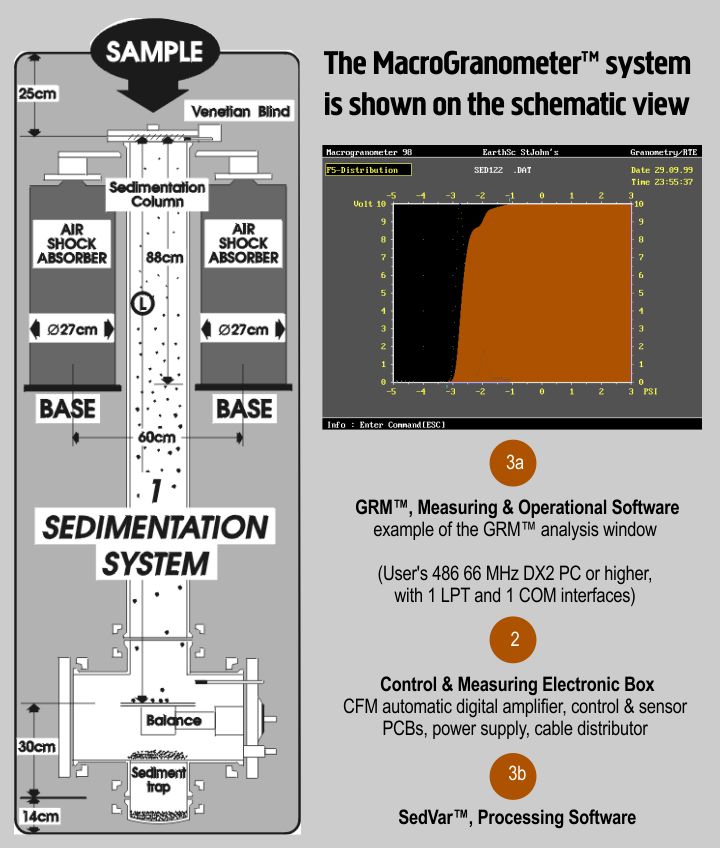
MEASURING RANGE: 0.016 - 4 mm quartz density materials: 0.044 - 4 mm heavier materials: may be finer, such as 0.016 - 1 mm; SAMPLE SIZE: smallest, statistically representative samples of
15,000 - 20,000 grains (0.1 - 5 gram);SETTLING RATE RESOLUTION: 0.02 PSI WEIGHT RESOLUTION: 0.01 %
RESULTS: semi graphic and full graphic print-outs showing distributions of the six sedimentation variables listed above, such as laboratory, standard and local sedimentation velocities, grain size, density, shape factor and Reynolds' number including either variable size, density or shape factor.
The standard sedimentation velocity and Reynolds' number are available variables also for sieve fractions (constant sizes) and heavy liquid fractions (constant size and density); each variable is resolved into 401 logarithmically equidistant intervals.Mean, spread, asymmetry & peakedness are calculated as moment and percentile distribution characteristics of each variable. Other characteristics may be included upon wish.The program Sed 3D Graph™ (part of the SedVar™ program) permits a graphical display of a group of distributions, either according to the samples' geographic horizontal or vertical location, or according to another desired variable. For example, a group of PSI-settling velocity (and grain density) distributions, each from a constant grain size fraction, can be plotted according to their PHI-grain size. The optional program SHAPE™:
- decomposes an input distribution (PSI sedimentation velocity distribution and PHI sieving size distribution) into as many as five mixed distribution components, each normally distributed;
- matches a PHI sieve distribution to the PSI sedimentation velocity distribution of the same sample;
- from the PHI-PSI couples, it computes Shape Factor values to each 0.02-PSI sedimentation velocity value.
Our SedVar™ program can use this set of the variable SF values to adjust the sedimentation grain size distributions of similar samples (the results of the MacroGranometer™) to the sieving; in other words, this way, it can simulate the sieving errors (they are required by the national and international sieving standards).